7. Task Pane Tour
7.1 Company & Reports
Manage which XBRL report (the structured financial/non-financial data file) you work with in Microsoft Excel.
-
Demo reports: Two demo datasets are available out of the box: US‑GAAP (United States GAAP) and ESEF/IFRS (European Single Electronic Format / IFRS).
-
Get XBRL reports on the Web: Click Get XBRL reports on the Web to open filing portals — US‑GAAP/IFRS (SEC EDGAR), ESEF / IFRS (Europe), or More portals… For download workflows, see Chapter 6. (Screenshot: portal dropdown below.)
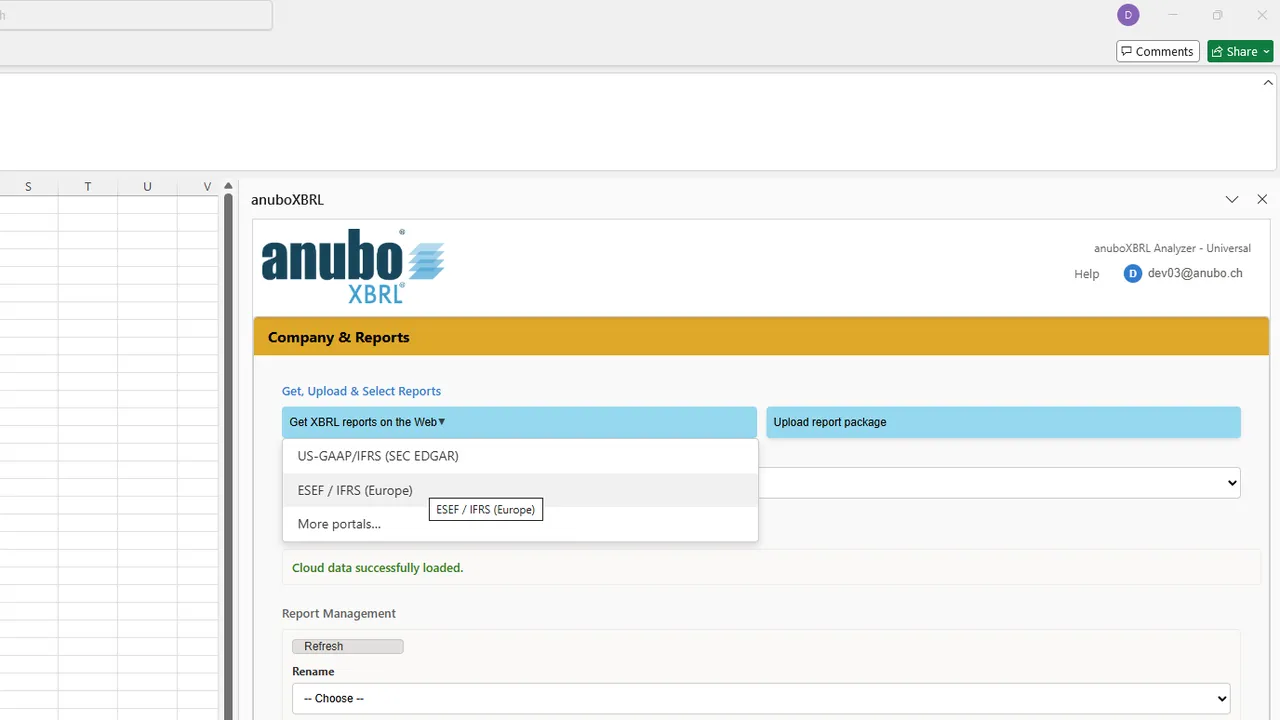
Get XBRL reports on the Web — SEC EDGAR, ESEF / IFRS (Europe), and More portals…
-
Upload report package: Click Upload report package to add your own report as a
.zipor.xbrifile. -
Provide Additional Information: After you choose a file, the Provide Additional Information dialog opens. Enter Company Abbreviation (2–40 letters or numbers; used in ANUBO functions), Company Name, and Closing Date (YYYY-MM-DD), then click Upload File. (Screenshot: upload dialog below.)
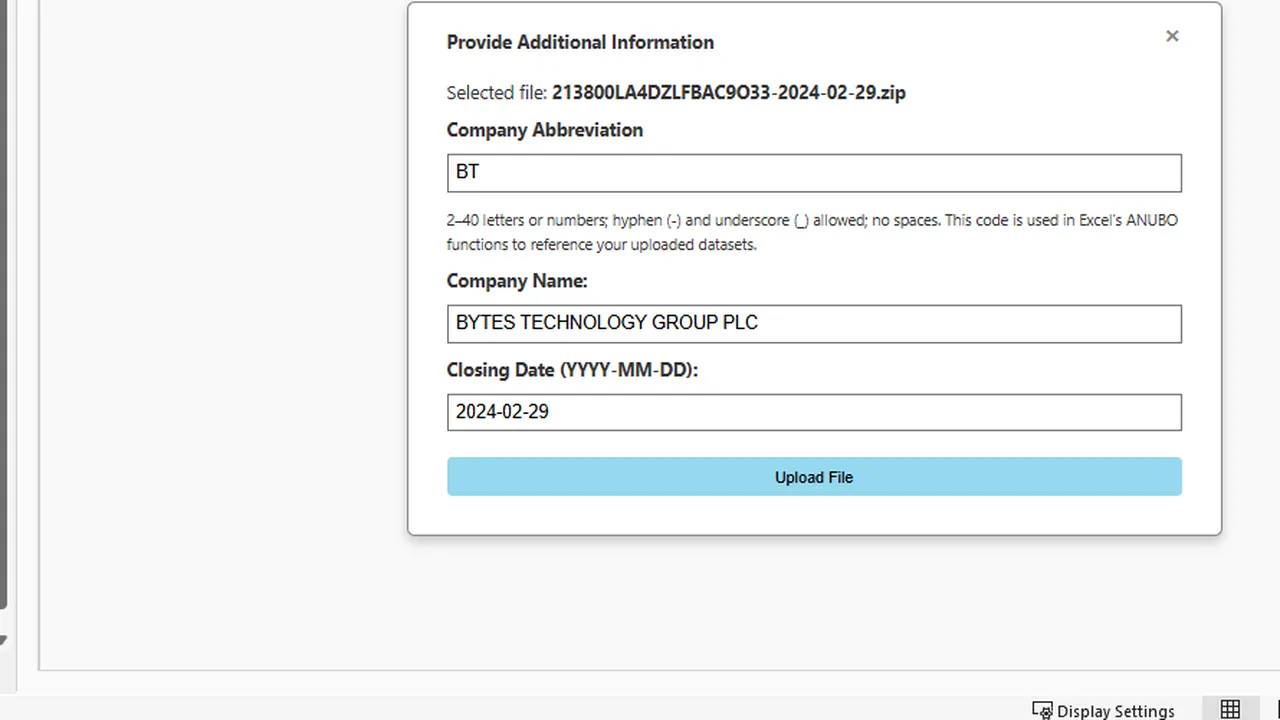
Provide Additional Information — confirm abbreviation, company name, and closing date before upload.
-
After uploading, the report appears in the Select report dropdown list.
-
Uploaded reports are stored in your personal cloud space (only you can access them). Personal cloud is your private online storage space for uploaded reports.
-
Storage limits (per user): anuboXBRL Reader: up to 10 reports; anuboXBRL Analyzer basic: up to 100 reports.
-
Select a report: Choose a company/report from the dropdown. Selection automatically triggers either processing of the XBRL report (first time) — processing converts the raw XBRL data into a format that Microsoft Excel can work with — or retrieval of the already processed dataset from your personal cloud.
-
Rename: You can rename a report (e.g., to a clear, short Company Abbreviation). The Company Abbreviation is what appears in ANUBO custom functions (e.g.,
=ANUBO.XBRLValue(CompanyAbreviation, ...)or=ANUBO.XBRLValue("DEMO_MICROSOFT_10K", ...)). (Screenshot: Rename dialog below.) -
Delete: Remove an uploaded report from your personal cloud when it’s no longer needed. This action removes it from the report dropdown and frees personal storage. (Delete uses the Delete dropdown in the same Report Management area.)
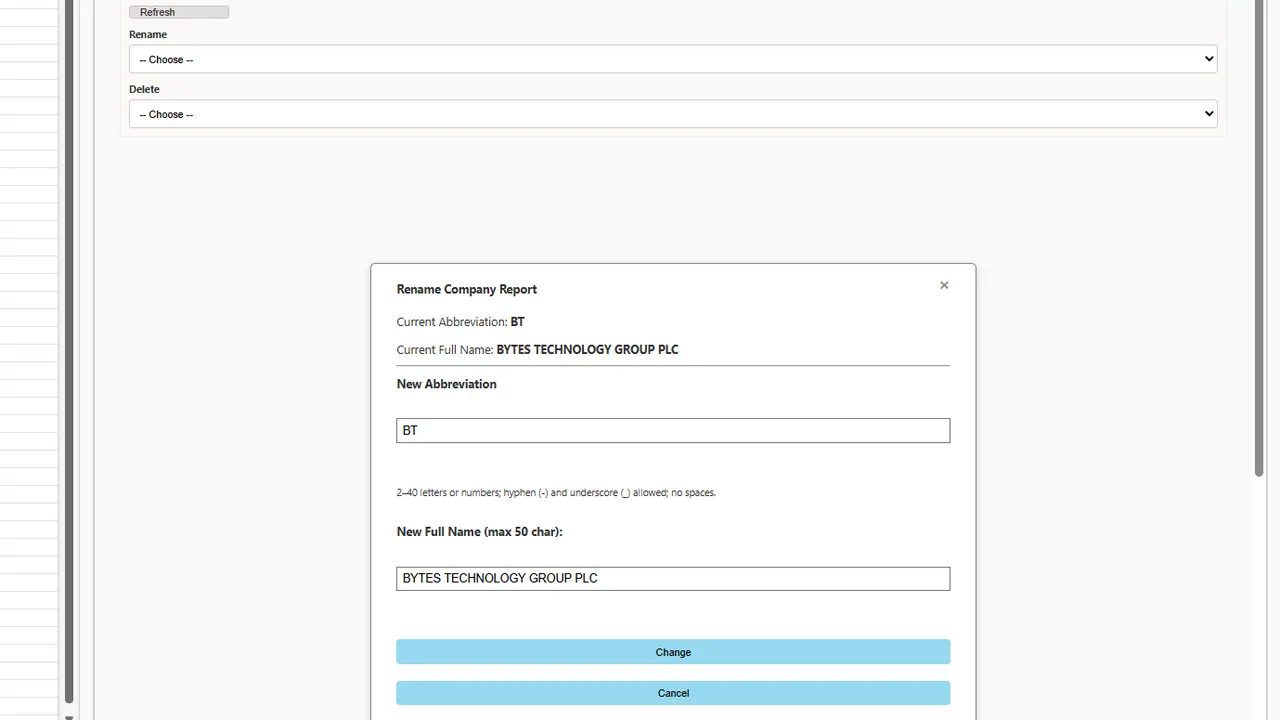
Rename Company Report — change abbreviation and full name; Delete is available from the dropdown above.
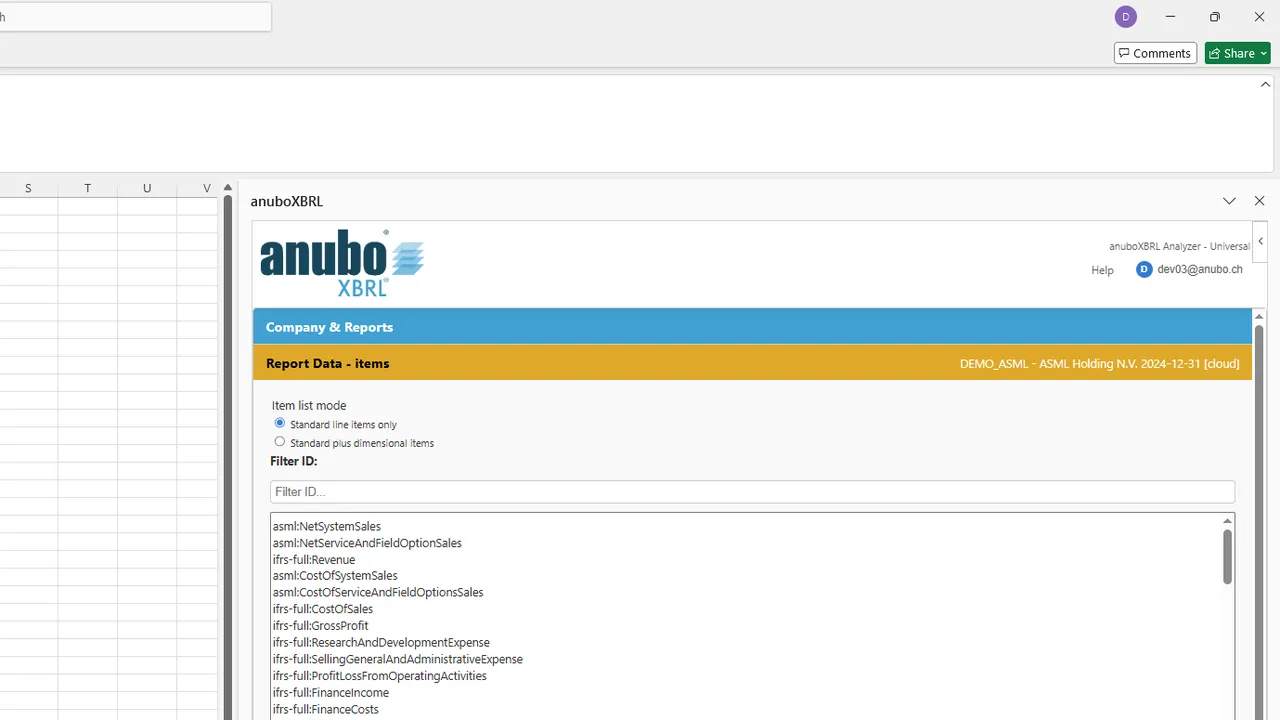
7.2 Report Data – Items
Use Report Data - items to search for a reported concept or dimensional fact and insert labels and values into Excel.
Item list mode
Choose how the item list is built:
-
Standard line items only — simplified concept-based view for common line items without dimensional breakdowns. Uses
ANUBO.XBRLLabelandANUBO.XBRLValuewhen you insert formulas (Analyzer) or static values (Reader). -
Standard plus dimensional items — fact-based view including dimensional facts such as segments, regions, products, or other breakdowns. Uses precise fact identity and the BYDIMENSIONS custom functions (see Chapter 8) when you insert formulas.
Standard line items only
-
Filter ID: Narrow the concept list by taxonomy ID or label fragment.
-
Select a concept from the list.
-
Reporting Period: Choose instant or duration period for the selected concept.
-
Preview: The Value field shows the resolved fact; Additional Info shows Label, Period, Unit, Decimals, and Dimensions when available.
-
Actions: Insert_Label, Insert_Value, or BULK: Insert Labels and Values for the current selection.
Standard plus dimensional items
-
Filter concepts: Search concepts (and optionally dimension members).
-
Include dimension members in concept search: When checked, search matches dimension member labels as well as concept labels.
-
Select a concept; the facet panel opens for fact refinement:
-
Reporting Period — filter to one period or (all periods).
-
Filter facts — text filter on the resolved fact list.
-
Dimension facets — per-axis dropdowns to narrow members (e.g., region, segment).
-
Clear refinement filters — reset period, fact, and dimension filters.
-
-
Preview and Additional Info work the same as in standard mode. (Screenshots: facet panel and preview below.)
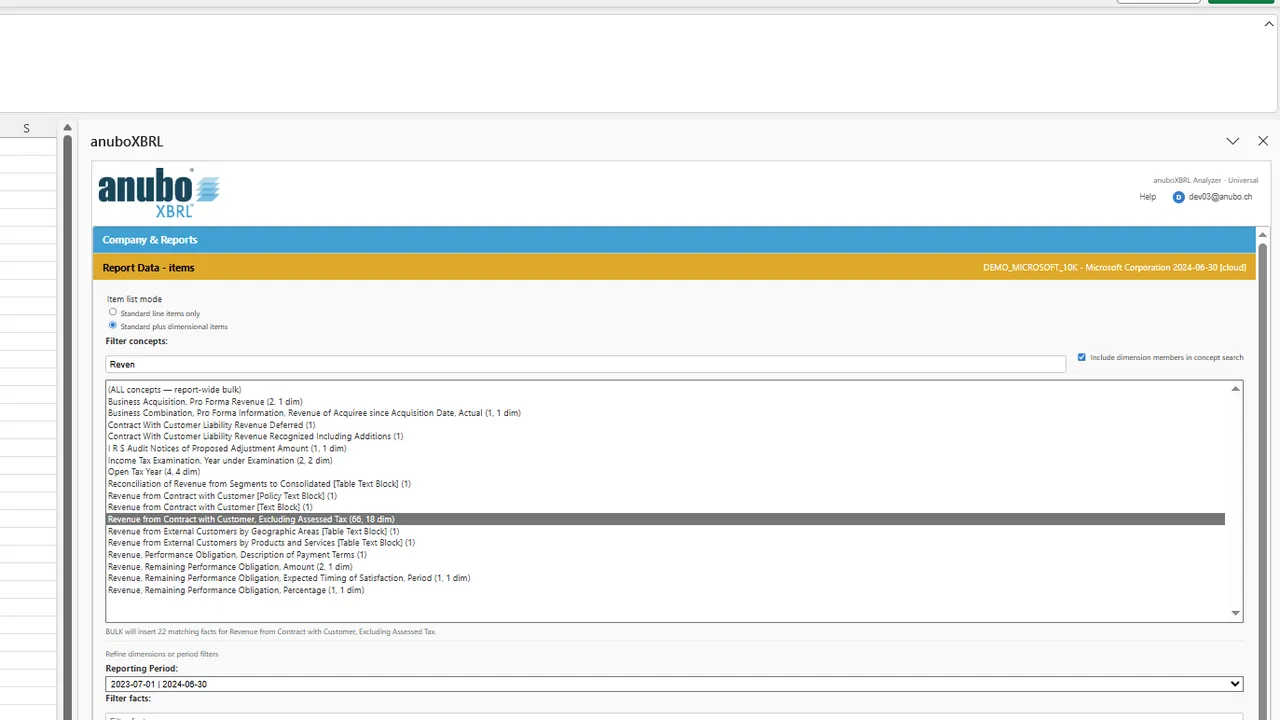
Dimensional facet panel — reporting period, fact filter, and per-axis member tags.
Preview — Value field and Additional Info (label, period, unit, decimals, dimensions).
-
Actions: Insert_Label, Insert_Value, and BULK: Insert Labels and Values insert BYDIMENSIONS-based formulas in Analyzer (static values in Reader).
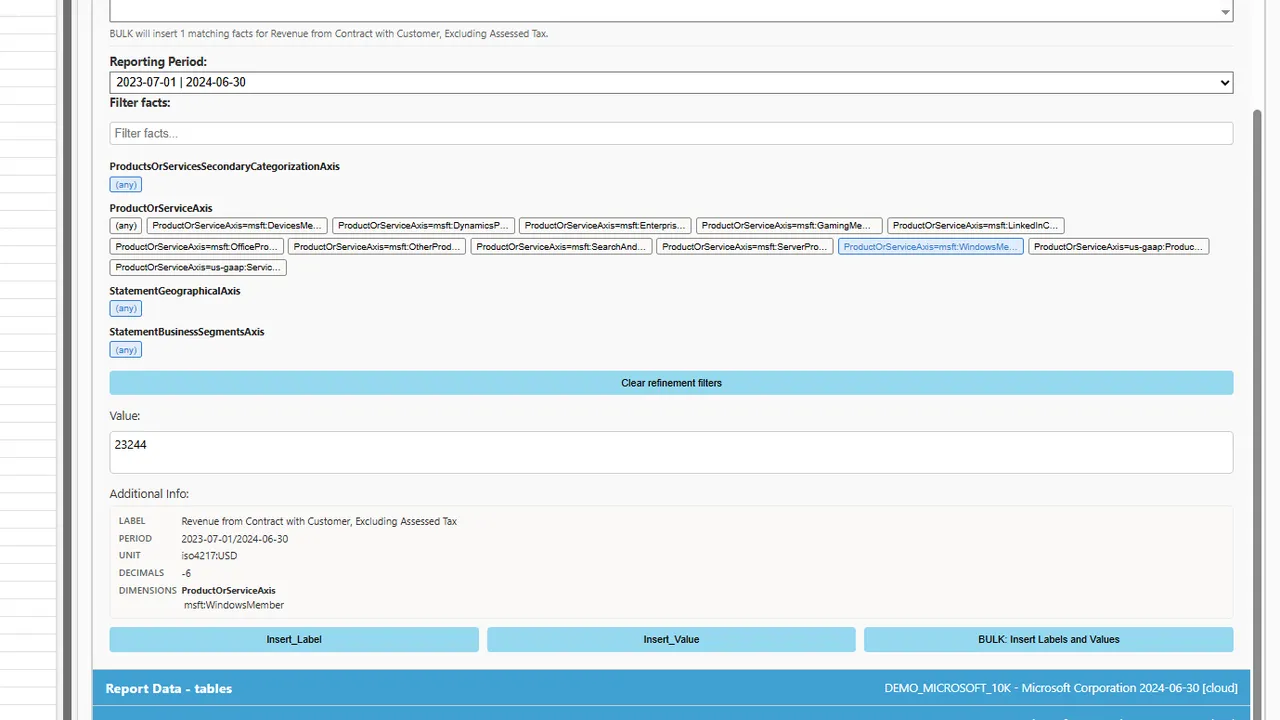
XBRLFACTLABELBYDIMENSIONS, XBRLFACTVALUEBYDIMENSIONS, etc.).7.3 Report Data – Tables
Use Report Data - tables to build a statement-style table for a selected presentation role.
-
Pick a link role (the layout of a table inside the report).
-
Click Insert. The add-in builds the table automatically: main lines, dimensional breakdowns, and remaining role concepts. Labels and values are resolved by concept, period, dimensions, unit, and role using BYDIMENSIONS formulas (Analyzer) or static values (Reader).
7.4 Report Data – Sections
Use Report Data - sections to insert one presentation section at a time.
-
Select a section from the list and insert curated groups of items in one step.
-
Best for simple statement navigation. Dimensional variants and repeated concepts with breakdowns are handled in Report Data - dimensional analysis (Section 7.5).
-
Behavior mirrors Items: Reader inserts static values; Analyzer inserts dynamic formulas.
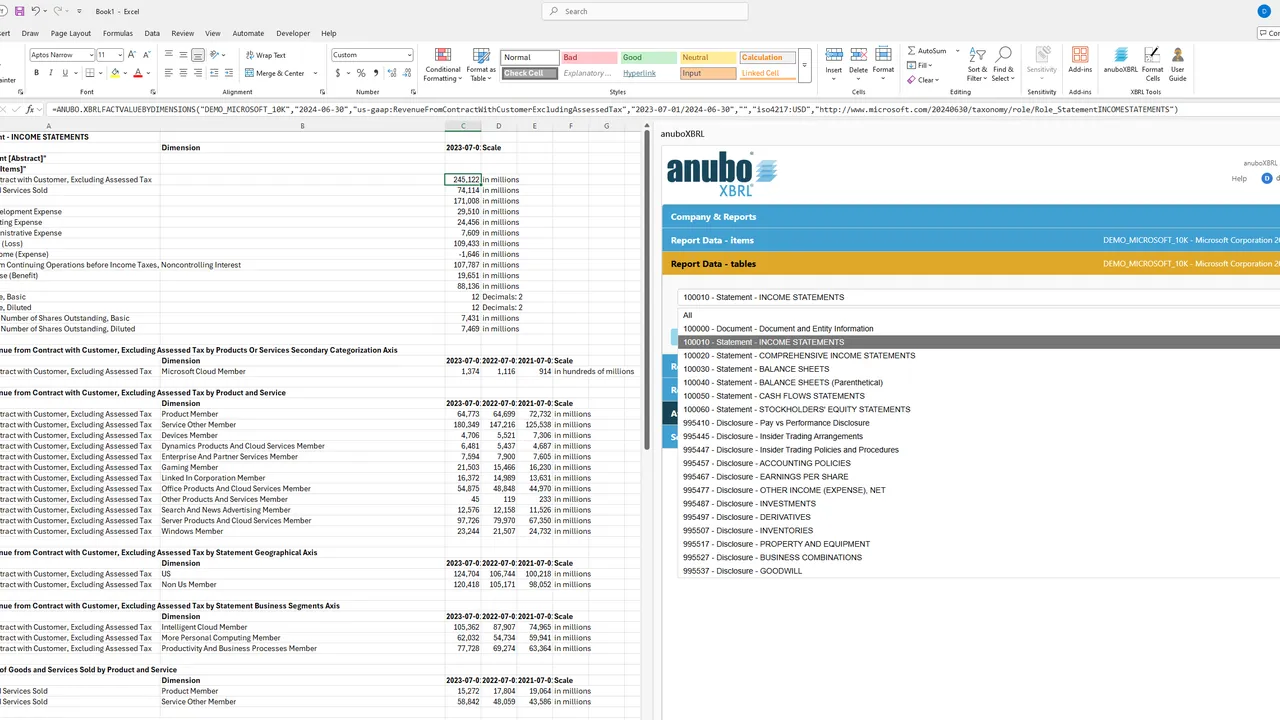
7.5 Report Data – dimensional analysis
Use Report Data - dimensional analysis to insert concepts from a selected role with dimensional filters — for analysis-ready tables when you need control over period, unit, and axis breakdowns before insert.
Filters
-
Role (required): Presentation link role to scope concepts.
-
Period: All or a specific reporting period.
-
Unit: All or a specific unit of measure.
-
Breakdown filters: Per-axis member filters appear when the role contains dimensional breakdowns.
-
Label / concept search: Narrow the preview list (e.g., Revenue, Cash, Lease).
Preview and view options
-
Preview shows how many rows match the current filters before insert.
-
View Mode:
- Business — analysis-ready output (default).
- Audit — adds technical metadata columns for traceability.
-
Always show period column: Include period even when a single period is selected.
Insert
- Click Insert to write the filtered result to the sheet. Analyzer uses BYDIMENSIONS formulas; see Chapter 8 for function details.
7.6 Attributes Premium
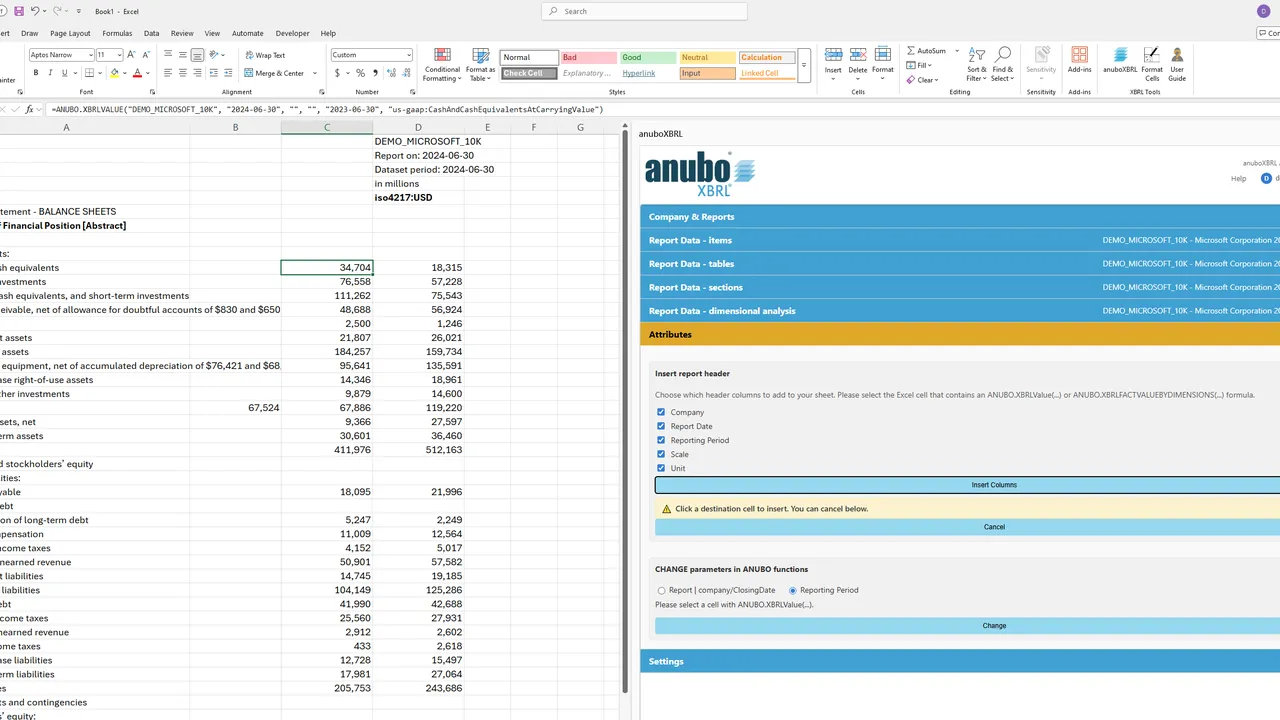
Attributes is an Analyzer feature for building report headers and bulk-updating ANUBO formula parameters. In Reader, the section remains visible but controls are disabled with a Premium overlay and upgrade prompt.
Insert report header
Add header columns next to your data using ANUBO metadata functions derived from an existing value formula.
Prerequisites
- Select one cell that contains either
=ANUBO.XBRLValue(...)(standard items) or=ANUBO.XBRLFACTVALUEBYDIMENSIONS(...)(dimensional items / tables / dimensional analysis).
Header columns (all preselected by default; uncheck any you do not need):
| Checkbox | Legacy source (XBRLValue) | BYDIMENSIONS source (XBRLFACTVALUEBYDIMENSIONS) |
|---|---|---|
| Company | ANUBO.XBRLReportCompany | ANUBO.XBRLReportCompany |
| Report Date | ANUBO.XBRLReportDate | ANUBO.XBRLReportDate |
| Reporting Period | ANUBO.XBRLDATASETPERIOD | ANUBO.XBRLFACTPERIODBYDIMENSIONS |
| Scale | ANUBO.XBRLDEC | ANUBO.XBRLFACTDECBYDIMENSIONS |
| Unit | ANUBO.XBRLUNIT | ANUBO.XBRLFACTUNITBYDIMENSIONS |
Workflow
- Select the source value cell in Excel.
- In Insert report header, choose the header columns and click Insert Columns.
- Click a destination cell where the first header column should go. Formulas are inserted downward in the same column (one row per selected header type).
- To abort, click Cancel in the prompt.
See Chapter 8 for function syntax.
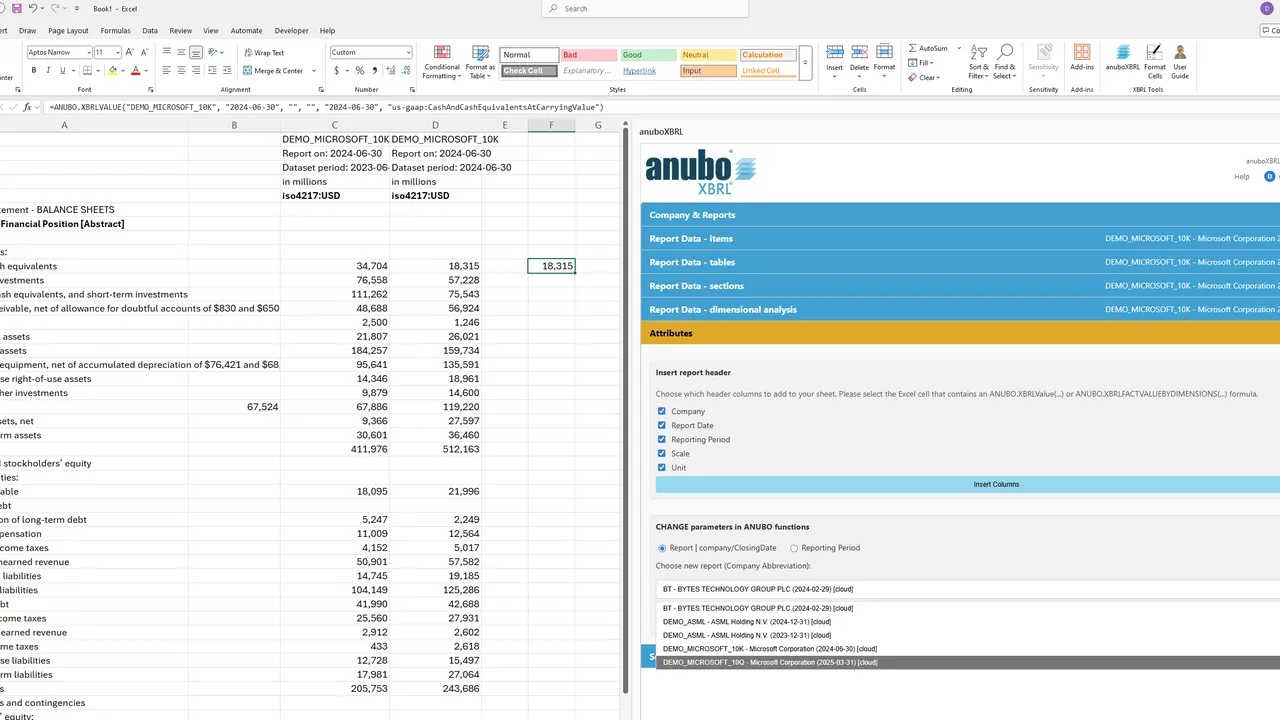
CHANGE parameters in ANUBO functions
Update parameters in all ANUBO formulas within the currently selected Excel range without editing cells individually.
Report | company/ClosingDate
- Choose Report | company/ClosingDate, pick a report from the dropdown (same list as Company & Reports), and click Change.
- Updates the company abbreviation and closing date (first two arguments) in every
ANUBO.XBRL…formula in the selection.
Reporting Period
- Choose Reporting Period. The add-in reads the concept from a selected cell containing
=ANUBO.XBRLValue(...). - The task pane must show the same report as that cell (matching company abbreviation and closing date). If they differ, a notice appears and Change is disabled until you select the matching report in Company & Reports.
- When aligned, pick a reporting period from the dropdown and click Change. Updates dataset start and end dates (fourth and fifth arguments) in legacy ANUBO functions (
XBRLValue,XBRLLabel,XBRLReportCompany,XBRLReportDate,XBRLDATASETPERIOD,XBRLDEC,XBRLUNIT) within the selection.
7.7 Settings and Status
The Settings accordion collects preferences and diagnostics. Above the accordions, the task pane header shows your product and domain (for example anuboXBRL Analyzer - Excel) and provides quick access to Help and Account menus.
Highlight color for company-specific extensions
Configure how the Excel ribbon command Format Cells highlights taxonomy concepts that use company-specific extensions (non-standard QName prefixes).
-
Highlight color theme: Choose a color swatch (Classic Dark Blue, Anubo Teal, Anubo Blue, Anubo Gold, Forest Green, or Burgundy). Your choice is saved for future sessions.
-
Non-standard taxonomy prefixes: After a report is loaded, check the prefixes you want treated as company-specific extensions. Standard prefixes such as
ifrs-fullandus-gaapare not listed. Prefix selections apply to the currently loaded report and reset when you load a different report. -
Format Cells (ribbon): Select cells containing ANUBO formulas, then click Format Cells. The command applies thousands separators to numeric values and, for cells whose concept prefix you selected above, applies the chosen highlight color. Supported formulas include legacy functions (
XBRLLabel,XBRLValue) and BYDIMENSIONS functions (XBRLFACTLABELBYDIMENSIONS,XBRLFACTVALUEBYDIMENSIONS,XBRLFACTDIMENSIONBYDIMENSIONS).
Preferences
-
Display detailed status information in “Company & Reports”: When enabled, shows the Company & Reports status panel (selected report, processing state, and related messages). When disabled, that panel is hidden; basic messages may still appear elsewhere in the section.
-
Automatically open the download guide when opening SEC (EDGAR) or ESEF portals: When enabled (default), opening US‑GAAP/IFRS (SEC EDGAR) or ESEF / IFRS (Europe) from Get XBRL reports on the Web also opens the User Guide section on downloading reports. Disable this if you prefer only the filing portal tab.
-
Show technical XBRL details for the “Report Data - …” sections: When enabled, shows the ℹ info buttons on Report Data accordions (items, tables, sections, dimensional analysis). Click ℹ for short technical explanations of each section’s behavior.
About anuboXBRL Add-in
Expand About anuboXBRL Add-in for diagnostics useful when contacting support:
Environment info
- Add-in build version, manifest version, Excel version, platform (Windows, Mac, Web, etc.), runtime (WebView2/Edge, Chromium, …), browser (for Excel Online), operating system, locale, and time zone.
License & account
- anubo account email, linked Microsoft account (when available), product and edition, license status (with expiry when applicable), tenant, and subscription identifier.
Reload add-in (troubleshooting)
If product information stays on Loading… for an extended period, a Reload add-in button may appear in the task pane header. It clears local storage and reloads the task pane — useful after network errors or a stuck session. Note that some preference checkboxes may reset after a reload.