5. Quick Start
5.1 Open the add-in panel
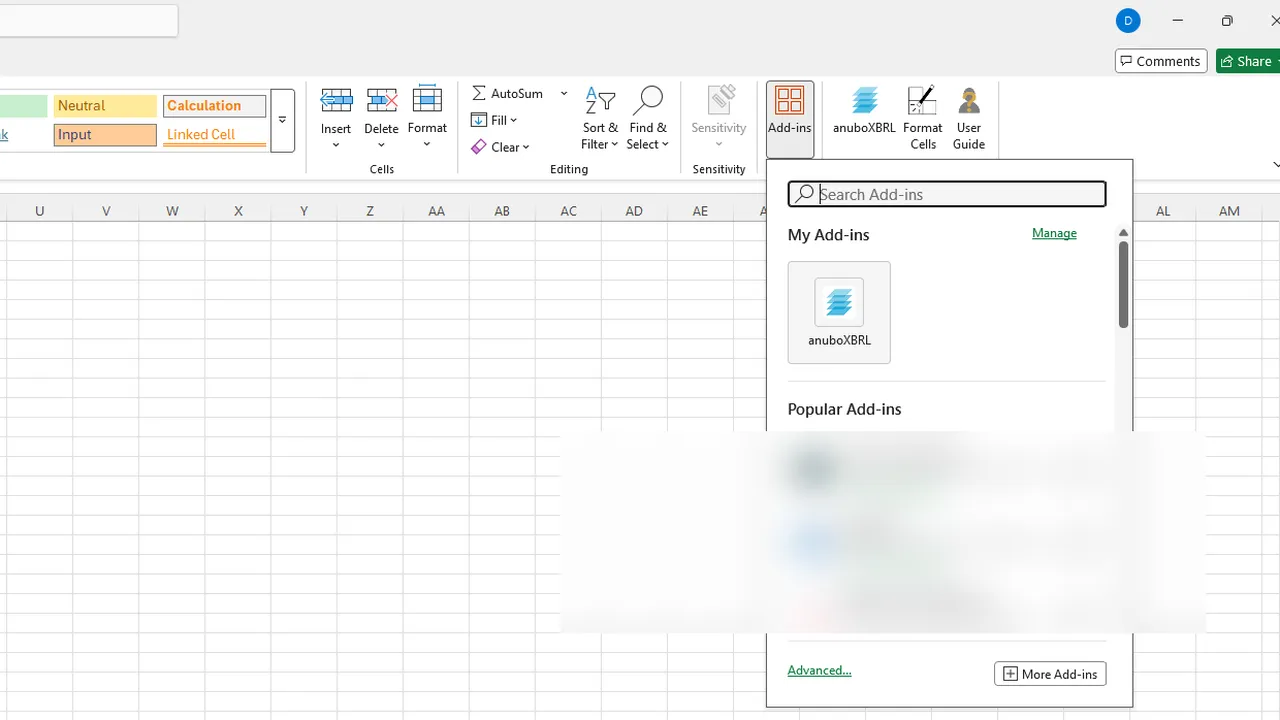
Microsoft Excel → Insert tab → Add-ins → anuboXBRL (under My Add-ins). The add-in panel appears on the right.
5.2 Load a report
-
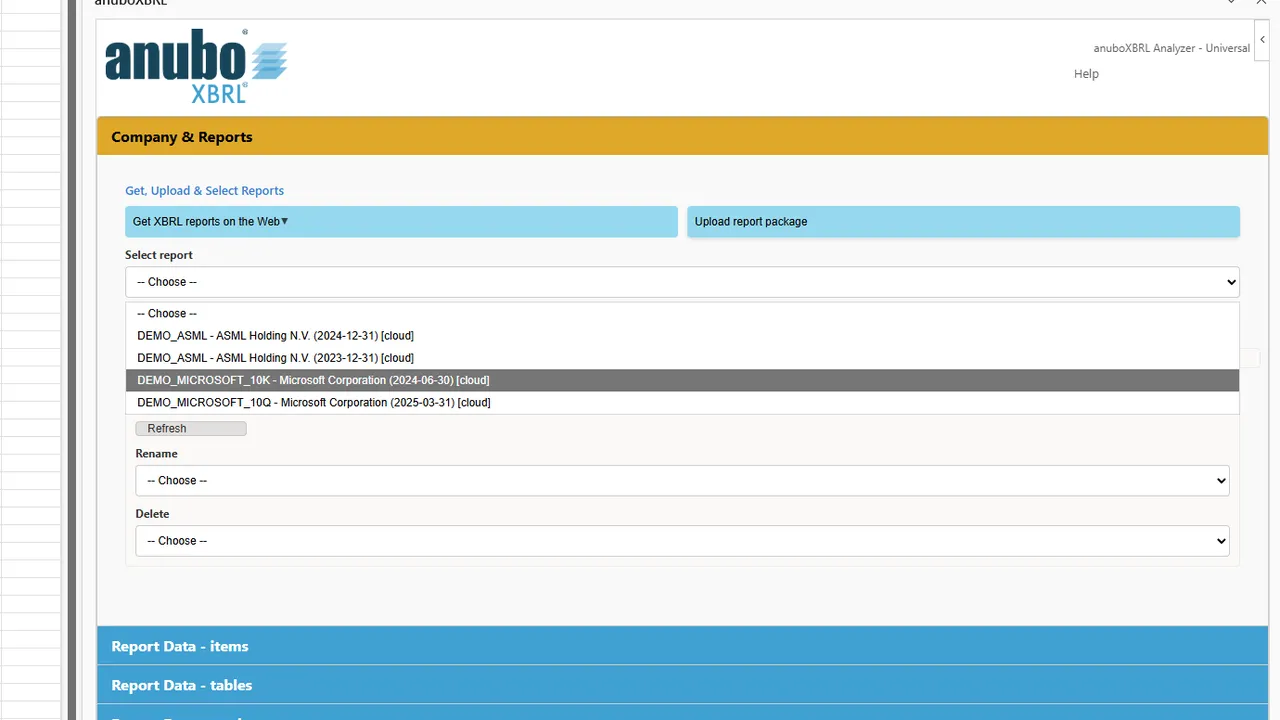
In Company & Reports, choose a report from Select report (company abbreviation and closing date).
-
Selection automatically starts processing (first time) or loads the already processed dataset from your personal cloud.
5.3 Insert a label and a value
-
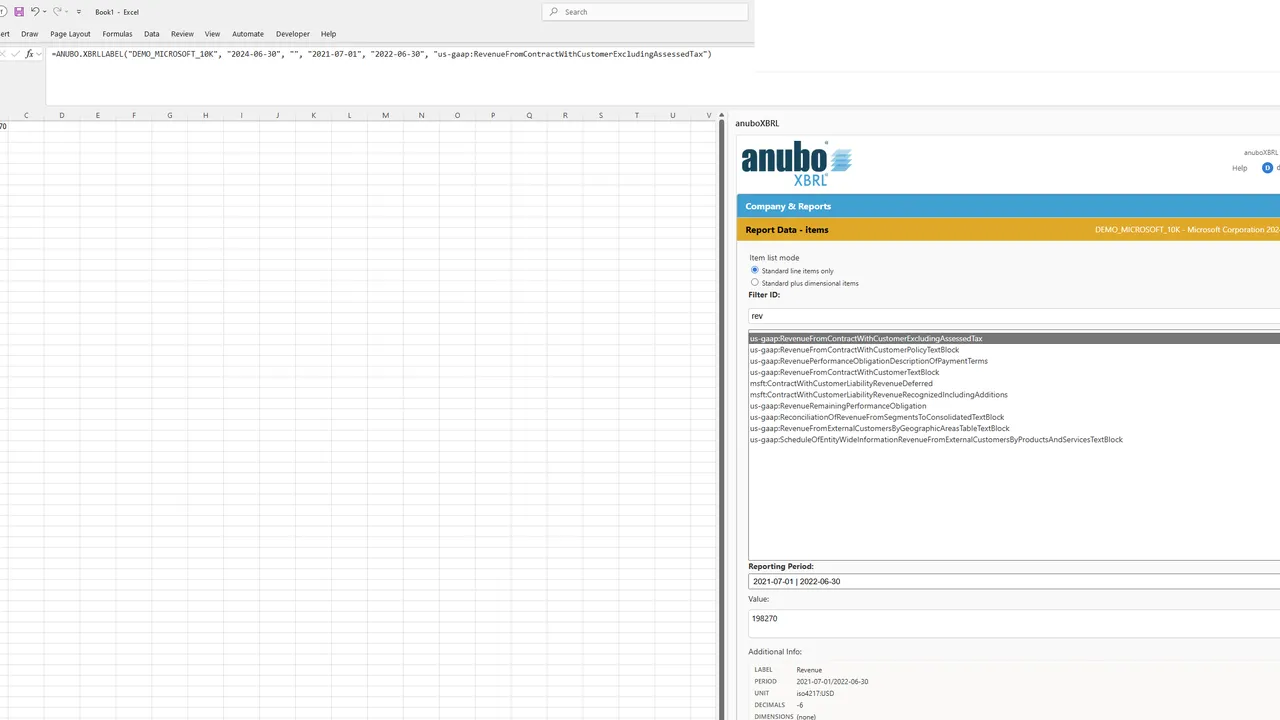
Go to Report Data – items (leave Item list mode on Standard line items only for this quick start).
-
Filter ID or scroll to select a concept (e.g., Revenue), then choose Reporting Period (instant = single date; duration = date range).
-
Select a cell in the sheet and click Insert Label or Insert Value.
5.4 Create a table
-
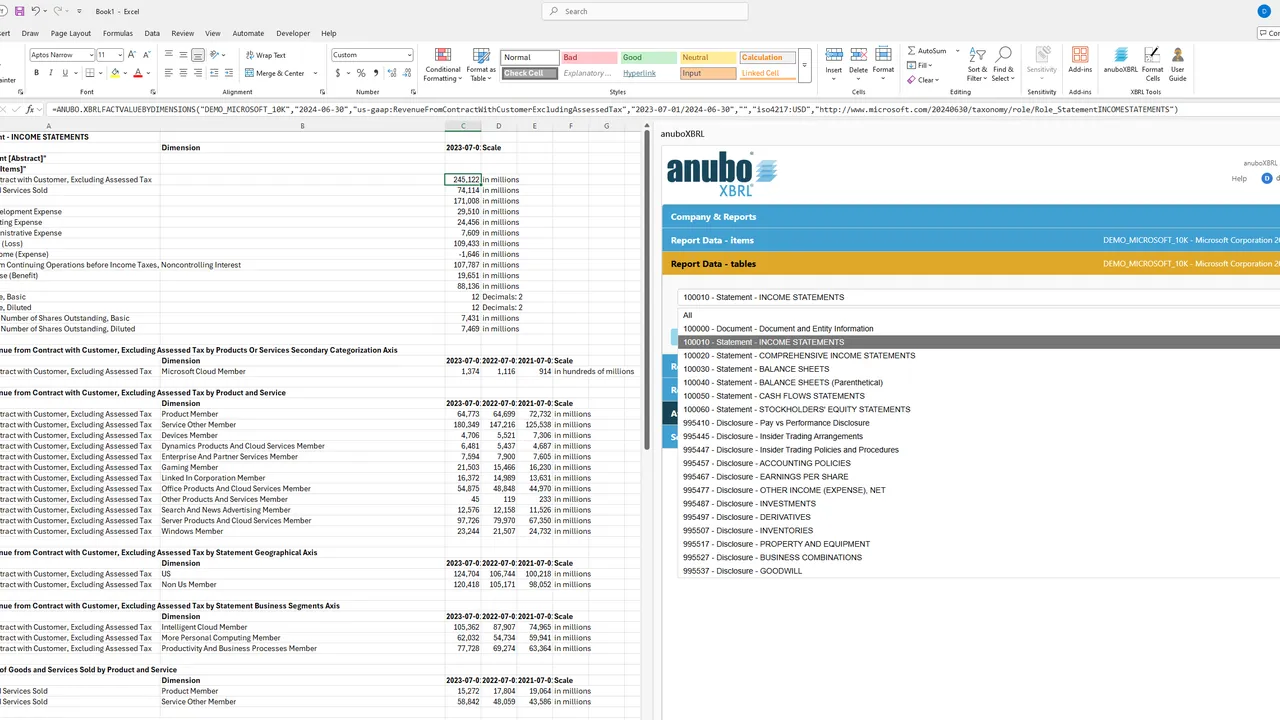
Open Report Data – tables.
-
Pick a link role (the layout of a table inside the report).
-
Click Insert. The add-in builds the table automatically: main lines, dimensional breakdowns, and remaining role concepts.
-
For finer control over period, unit, or axis members before insert, use Report Data – dimensional analysis (Section 7.5).